Skip to content
Exploring Common Candlestick Patterns in Crypto Trading

Luis Clark
Luis is a personal finance expert who has been passionate and writing about crypto for more than five years.
Table of Contents
Add a header to begin generating the table of contents
Cryptocurrency trading can be a lucrative venture, but it requires knowledge and skill to navigate the ever-changing market. One tool that traders often rely on is candlestick patterns. These patterns provide valuable insights into market trends and can help predict future price movements. In this article, we will delve deeper into the world of candlestick patterns and explore their significance in crypto trading.
Understanding the Basics of Candlestick Patterns
Candlestick charts, also known as Japanese candlestick charts, have been used in trading for centuries. The origins of this charting system can be traced back to 18th-century Japan, where it was first used to analyze the price movement of rice. Today, candlestick patterns are widely used in various financial markets, including cryptocurrencies.
A candlestick consists of a rectangular body and two wicks or shadows, one extending above the body and one below it. The body represents the price range between the opening and closing of a particular time period, while the wicks indicate the highest and lowest price reached during that period. By examining the shape and color of the candlesticks, traders can gain valuable insights into market sentiment.
The Origin and History of Candlestick Patterns
Candlestick patterns originated in Japan during the 17th century, where they were used by rice traders to predict future price movements. It was the renowned Japanese rice trader, Homma Munehisa, who first noticed the relationship between supply and demand and developed a method to visualize it using candlesticks.
Homma’s techniques were later refined and popularized by Steve Nison, an American trader, in his book “Japanese Candlestick Charting Techniques.” Nison’s work introduced candlestick charts to the Western world, and they quickly gained recognition for their ability to provide valuable insights into market trends.
The Significance of Candlestick Patterns in Trading
Candlestick patterns are a powerful tool for traders as they provide visual representations of market sentiment. By analyzing the patterns and formations that candlesticks create, traders can make informed decisions about when to enter or exit a trade.
Each candlestick pattern has its own significance. Bullish patterns indicate a potential upward trend, while bearish patterns suggest a potential downward trend. By recognizing these patterns early on, traders can take advantage of price movements and maximize their profits.
Furthermore, candlestick patterns can also help traders identify potential reversals in the market. Reversal patterns occur when a trend is about to change direction, providing traders with opportunities to capitalize on market fluctuations.
Types of Candlestick Patterns in Crypto Trading
There are various types of candlestick patterns that traders should be familiar with. These patterns can be classified into single candlestick, dual candlestick, and triple candlestick patterns. Let’s explore each category in more detail.
Single Candlestick Patterns
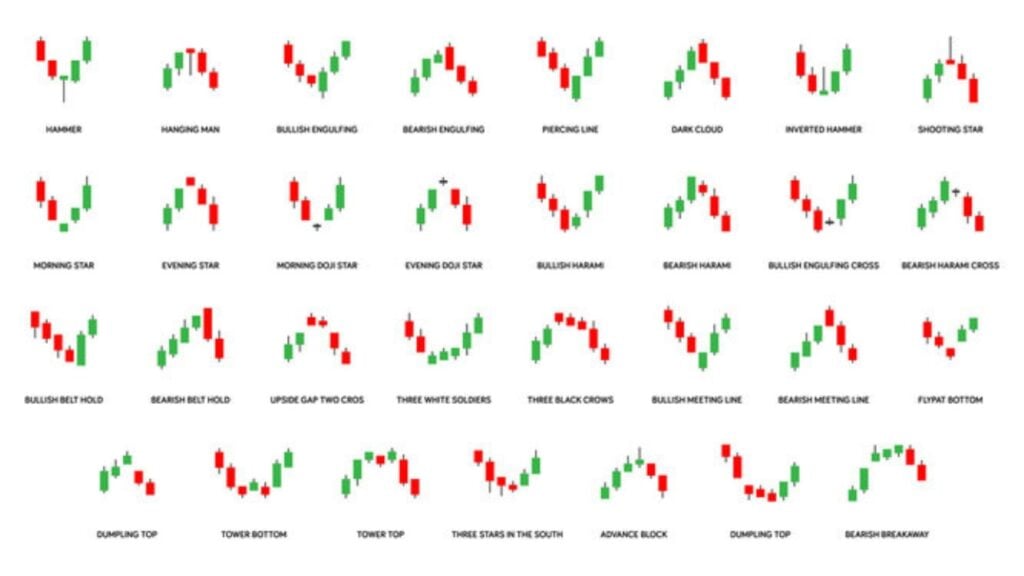
Single candlestick patterns are formed by a single candle and can provide valuable insights into market sentiment. Some common single candlestick patterns include:
- The Hammer pattern, which indicates a potential trend reversal after a downtrend.
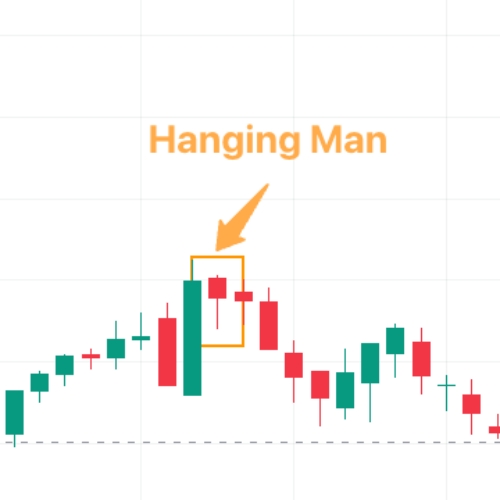
- The Hanging Man pattern, which suggests a potential trend reversal after an uptrend.
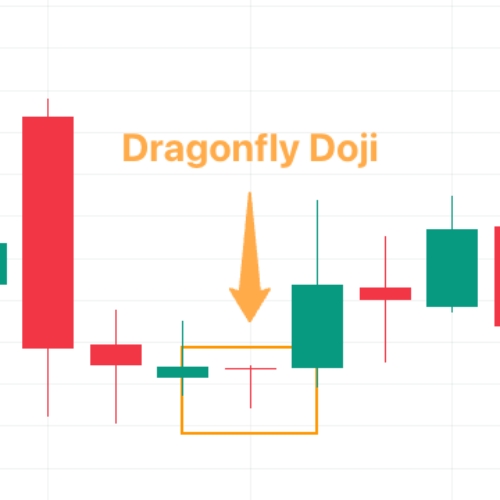
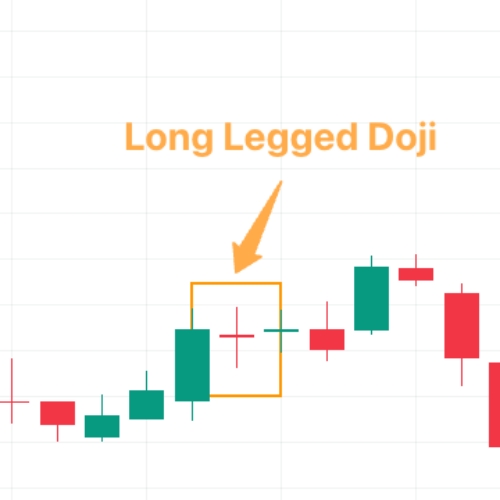
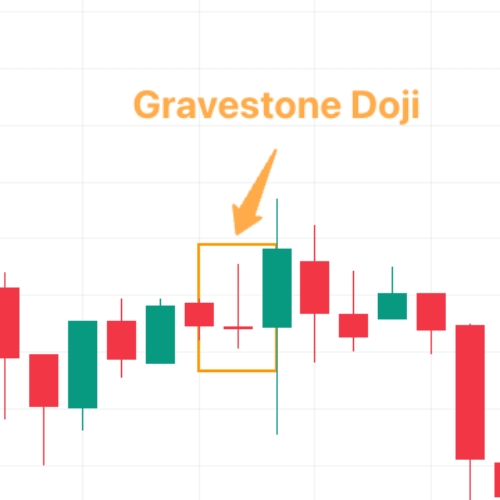
- The Doji pattern, which occurs when the opening and closing prices are virtually the same and indicates indecision in the market.
By recognizing these patterns, traders can gain valuable insights into market sentiment and make informed trading decisions.
Dual Candlestick Patterns
Dual candlestick patterns consist of two consecutive candles and can provide insights into potential market reversals. Some common dual candlestick patterns include:
- The Bullish Engulfing pattern, which occurs when a small bearish candle is followed by a larger bullish candle, indicating a potential trend reversal.
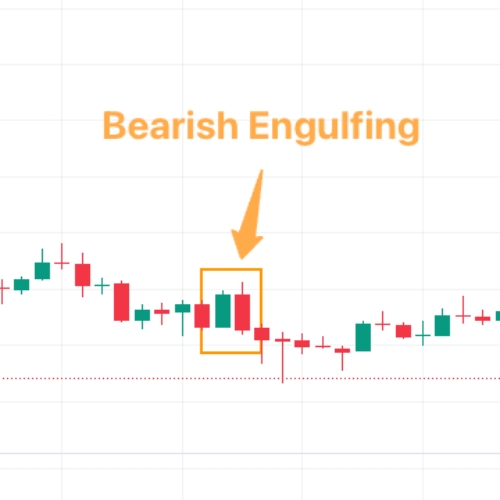
- The Bearish Engulfing pattern, which is the opposite of the bullish engulfing pattern and suggests a potential trend reversal from bullish to bearish.
By understanding these patterns, traders can anticipate potential trend reversals and adjust their trading strategies accordingly.
Triple Candlestick Patterns
Triple candlestick patterns consist of three consecutive candles and can provide insights into potential market reversals. Some common triple candlestick patterns include:
- The Morning Star pattern, which is formed by a long bearish candle, followed by a small bullish or bearish candle, and completed by a large bullish candle. This pattern indicates a potential trend reversal from bearish to bullish.
- The Evening Star pattern, which is the opposite of the morning star pattern and suggests a potential trend reversal from bullish to bearish.
By recognizing these patterns, traders can identify potential reversals and take advantage of market opportunities.
Interpreting Common Candlestick Patterns
Now that we have explored the different types of candlestick patterns, let’s take a closer look at some of the most commonly encountered patterns in crypto trading.
The Bullish and Bearish Engulfing
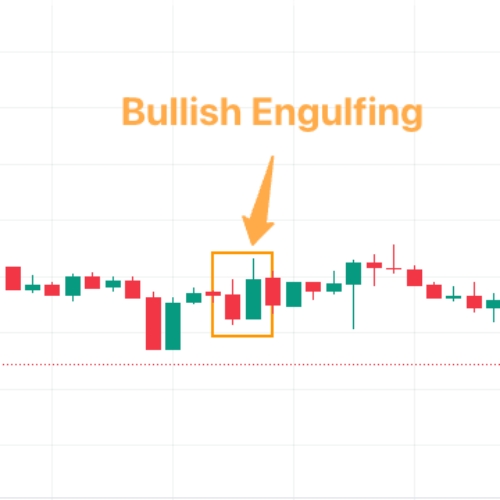
The bullish engulfing pattern occurs when a small bearish candle is followed by a larger bullish candle that completely engulfs the previous candle. This pattern indicates a potential trend reversal from bearish to bullish.
Conversely, the bearish engulfing pattern occurs when a small bullish candle is followed by a larger bearish candle that completely engulfs the previous candle. This pattern suggests a potential trend reversal from bullish to bearish.
The Hammer and Hanging Man
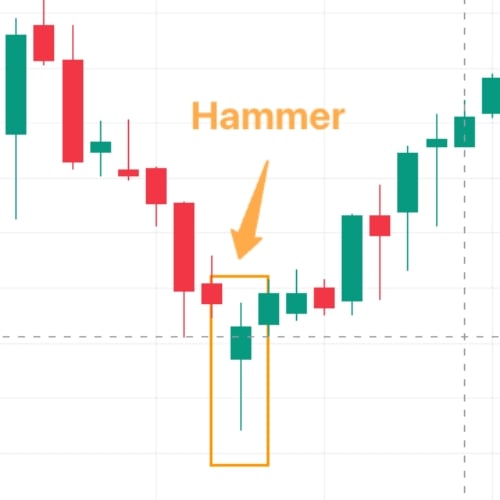
The hammer pattern is characterized by a small body and a long lower shadow. It occurs after a downtrend and suggests a potential trend reversal. The presence of a hammer pattern indicates that buyers are stepping in and trying to push the price back up.
The hanging man pattern is similar to the hammer, but it occurs after an uptrend. It suggests a potential trend reversal from bullish to bearish. The presence of a hanging man pattern indicates that sellers are starting to exert pressure on the market.
The Doji Patterns
Doji patterns occur when the opening and closing prices are virtually the same. They indicate indecision in the market and can signify potential trend reversals. Depending on their location and previous price action, doji patterns can have bullish or bearish implications.
The Role of Candlestick Patterns in Crypto Trading
Now that we have a good understanding of candlestick patterns and their significance, let’s explore their role in crypto trading.
Enhancing Trading Strategies with Candlestick Patterns
Incorporating candlestick patterns into trading strategies can enhance the overall effectiveness of a trader’s approach. By combining candlestick analysis with other technical indicators, such as moving averages or trendlines, traders can make more informed decisions and increase their chances of success.
For example, a trader may use a moving average crossover strategy in conjunction with candlestick patterns. When a bullish candlestick pattern forms, the trader may wait for the price to cross above a particular moving average before entering a long position. This combination of technical indicators can provide additional confirmation and increase the trader’s confidence in their trade.
As experts in crypto trading, we have witnessed firsthand the power of candlestick patterns in analyzing market trends and making profitable trading decisions. Learning to recognize and interpret these patterns takes time and practice, but it is well worth the effort.
One piece of advice we can offer is to always combine candlestick analysis with other technical indicators and risk management strategies. This will provide a more comprehensive view of the market and help you make more informed and calculated trading decisions.
Remember, patience and discipline are key in crypto trading. Stick to your trading plan and always manage your risk wisely. With dedication and the right skills, candlestick patterns can be a valuable tool in your trading arsenal.
FAQ
Most frequent questions and answers
Candlestick patterns are graphical representations of price movements in a market, depicted through candle-like figures on a chart. Each pattern provides insights into market sentiment and potential future price movements. In crypto trading, understanding these patterns is crucial for predicting market trends and making informed trading decisions.
A Bullish Engulfing pattern occurs when a small bearish candle is followed by a larger bullish candle, signaling a potential trend reversal from bearish to bullish. In contrast, a Bearish Engulfing pattern happens when a small bullish candle is followed by a larger bearish candle, indicating a potential shift from a bullish to a bearish trend.
The Hammer pattern, characterized by a small body and a long lower shadow, appears after a downtrend and suggests a potential upward trend reversal, indicating buying interest. The Hanging Man pattern, similar in appearance but occurring after an uptrend, suggests a potential downward trend reversal, indicating selling pressure.
Candlestick patterns should be used alongside other technical indicators, such as moving averages or trendlines, for a more comprehensive trading strategy. This combined approach allows traders to confirm their analyses and make more informed decisions. It’s important to incorporate risk management strategies and maintain discipline in following a trading plan.
Skrumble.com provides all its content for informational purposes only, and this should not be taken as financial advice to buy, trade, or sell any investment instruments or products, including but not limited to cryptocurrencies, or use any specific exchange. Please do not use this website as investment advice, financial advice, or legal advice, and each individual’s needs may vary from that of the author. Investing in financial instruments, including cryptocurrencies, carries a high risk and is not suitable for all investors. It is possible to lose the entire initial investment, so do not invest what you cannot afford to lose. We strongly advise conducting your own research before making any investment decisions. This post includes affiliate links with our partners who may compensate us.
To view our privacy policy read here.
You may also be interested in: